I’d like to preface this post with the fact that what I do on a day-to-day basis isn’t data science. I spend my days building the web-based tools that make using indico’s core tech easier. So when I was asked to do a small data science project and write a post about it, I truly felt a little out of my depth. I’m going to share the lessons and techniques I learned in hopes that it will help you with your own analysis work.
As an avid gamer, I thought it might be interesting to explore how others view two of the hottest games out there right now: Fortnite and Player Unknown Battlegrounds (PUBG). Both of these games feature a large PVP, last player standing style game—known as Battle Royale—as well as large, active fanbases. To try to get a better understanding of the players, we’ll turn to Twitter.
Both sets of data I will be working with in this project consist of several thousand tweets scraped using the Twitter API in early 2018, saved in JSON format. There are many ways in which you can pull down tweet dumps like this, but I used this easy-to-use scraper if you want to grab some yourself to analyze with this tutorial. This piece also assumes that you are familiar with writing Python and Javascript code at an intermediate level.
Approach and Getting Started
My first approach was to analyze each set of tweets with a couple of the most popular indico APIs: Sentiment and Emotion. I wanted to get a beat on how the players felt about the games overall. The first task was to build a script that iterated over our documents, made calls to the indico API in batches, and output the results to a CSV that I could import into a spreadsheet.
Let’s start by setting up a Python environment and adding our dependencies. For reference, I’m using Python 2.7 and virtualenv.
To follow along, you’ll need to pip install the following: tqdm, indicoio, and pandas. Additionally, you’ll need to have an indico API key.
To access the code, clone it from the GitHub repo.
A few notes about this script:
- We throw out non-English user tweets because the Emotion API only supports English, although Sentiment does offer multilingual support.
- There’s no recovery for batches that error out during the API calls. Instead, the batch of tweets is discarded. This is ok—since we are using such a large volume of data, it should not affect the results.
- Results are stored in memory until the job finishes, and then they are dumped to a CSV file via pandas. If you have an unreliable connection or are experiencing crashes, you might consider modifying the code to append to a CSV on each iteration.
- This script can make a LOT of calls to the API and therefore really ding your call allotment. Make sure that you have enough calls remaining in your monthly usage before running.
Initial Results
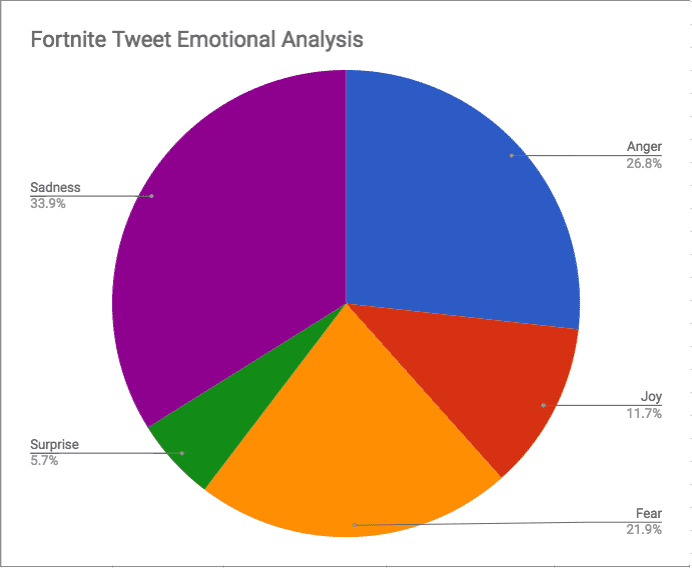
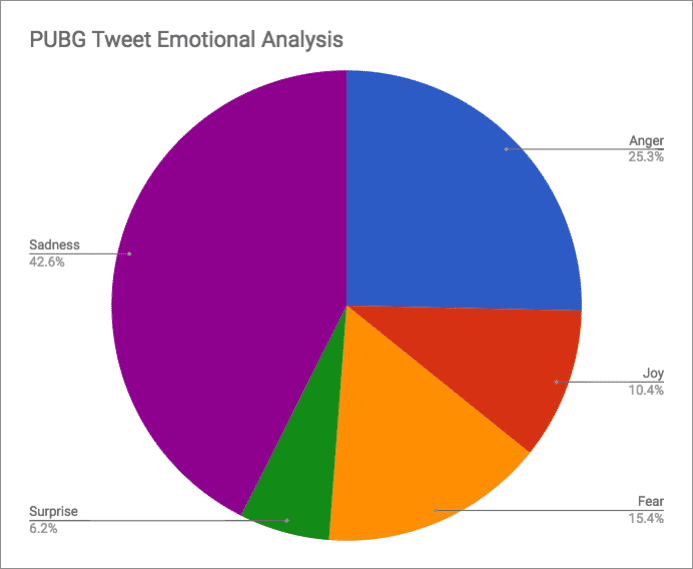
To begin with, I imported my results, as CSV, into Google Sheets*. The importer did a good job of detecting the columns and data types. From there it was pretty straight forward to do some simple math on the results and put together some graphs, as seen below. The sentiment scores were nearly identical for the two games at 0.56 and 0.58—fairly neutral results. The emotional responses, however, were mostly very negative. We see a solid majority of sad or angry interactions. With how negative social media, especially Twitter, can be and the fact that many gamers often like to talk trash either games or other players, I didn’t find these results especially surprising.
*Something to keep in mind: Sheets has a limit for how many rows are supported in a document. I believe it’s around 400k rows in total. This got me later when trying to import a third CSV into the same document.
Moving on to Keywords
Given that the results of the sentiment and emotion analysis were not very interesting, I thought I’d look at keywords next. I put together a similar script that ran the indico Keywords API on the text of every tweet. The script transforms the Keywords API results into a simple array of strings and adds that as a column of data. I figured that would be the easiest way to work with it.
To access the code, clone it from the GitHub repo.
Note: I kept in the timestamp for sorting and the URL to use as a key, in case you want to pivot with the other set of data.
As before, I imported the results into Google Sheets, and the default settings worked fine. But then I was stuck; I’m not a spreadsheet expert. I know how to do simple math in a spreadsheet, but that’s about it. I had no idea how to get meaning from this list of lists of words. So, I went to the Internet in search of answers.
And of course the Internet led me down a path that looked like this…
=ArrayFormula(QUERY(TRANSPOSE(SPLIT(JOIN(" ";B3:B);" ")&{"";""});"select Col1,
count(Col2) group by Col1 order by count(Col2) desc limit 10 label Col1 'Word',
count(Col2) 'Frequency'";0))
I spent a good hour trying to work out a similar formula that would work with my dataset. But after a while, I got frustrated not being able to debug my work, or really see what each step of the formula did to display limits within sheets.
Script Editor Saves the Day
I figured there had to be a better way to do complex logic in Google Sheets without messy nested formulas, and keep logs to see if my intermediate steps are functioning as expected. After a bit more searching, I came across Google’s Script Editor for G-Suite products. Script Editor is a tool that lets you write functions for your documents in plain Javascript. It consists of an in-browser IDE and a set of logging interfaces.
To launch to the editor, first go to the “Tools” menu and then select “Script Editor”. The editor will then open in another tab in your browser.
Give your project a name, such as “DEMO”, and enter the following code into the editor:
function doExponent(input, exp) {
  return Math.pow(input, exp);
}
Then in your spreadsheet, enter a value such as 4, into the cell A1. You can call your function on A1 by selecting cell A2 and typing the following in the function (fx) bar.
=DOEXPONENT(A1,4)
You should then see the value 256 displayed in A2. This is a very simple example, but you can extend it to do very complex things across many columns and rows of different sheets.
The code for the keywords function is slightly more complex than our example there, but the rules still hold. I defined a function that accepts an array of cells, as well as the number of most used (i.e., top n) words that I want returned.
It then loops over each row, splitting the data into individual words and adds them to a frequency dictionary. Once finished, we can then map to an array, sort the results, and slice off the top n words requested. I then return the results in a nice list along with headers, counts, and percentage of the results information.
function wordFrequency(columnArr, n) {
  var freqMap = {};
  var totalWords = 0;
  for (var i=0; i<columnArr.length; i++) {
    var words = columnArr[i][0].replace(/[[]']+/g,'').split(", ");
    totalWords += words.length;
    for (var j=0; j<words.length; j++) { var w = words[j].toLowerCase(); if (!freqMap[w]) { freqMap[w] = 0; } freqMap[w] += 1; } } var sortedWords = Object.keys(freqMap).map(function(w) { return { word: w, freq: freqMap[w] } }); sortedWords.sort(function(a,b) { if (a.freq > b.freq)
      return -1;
    else if (a.freq < b.freq)
      return 1;
    else
      return 0;
  });
  var totalTopWords = 0;
  var topWords = sortedWords.slice(0,n);
  topWords.forEach(function(topWord){
    totalTopWords += topWord.freq;
  });
  var headers = [["Keyword", "Frequency", "%of Total Words", "% of Top " + n + " Words"]];
  return headers.concat(topWords.map(function(w) {
    return [w.word, w.freq, w.freq/totalWords, w.freq/totalTopWords];
  }));
}
In a separate sheet from my results, I call this function on the keywords column of my results page.
=WORDFREQUENCY(fortnite_keywords_results!D2:D, 20)
For more information on using Script Editor with Google sheets see: https://developers.google.com/apps-script/guides/sheets/functions
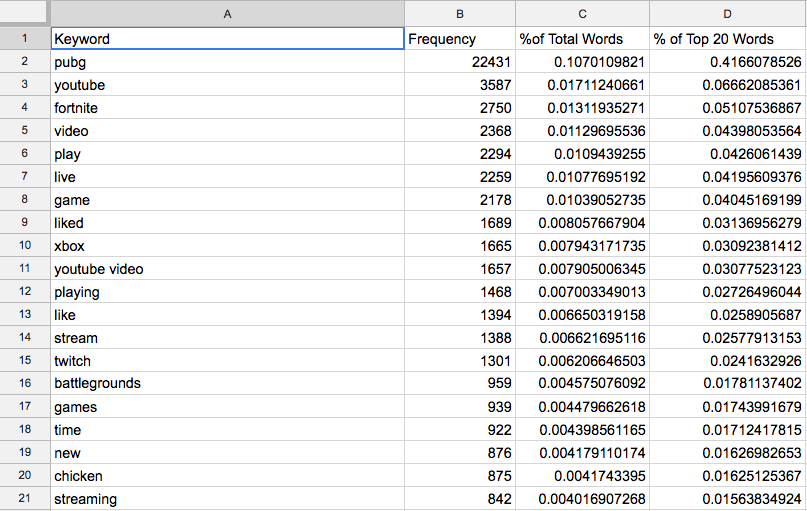
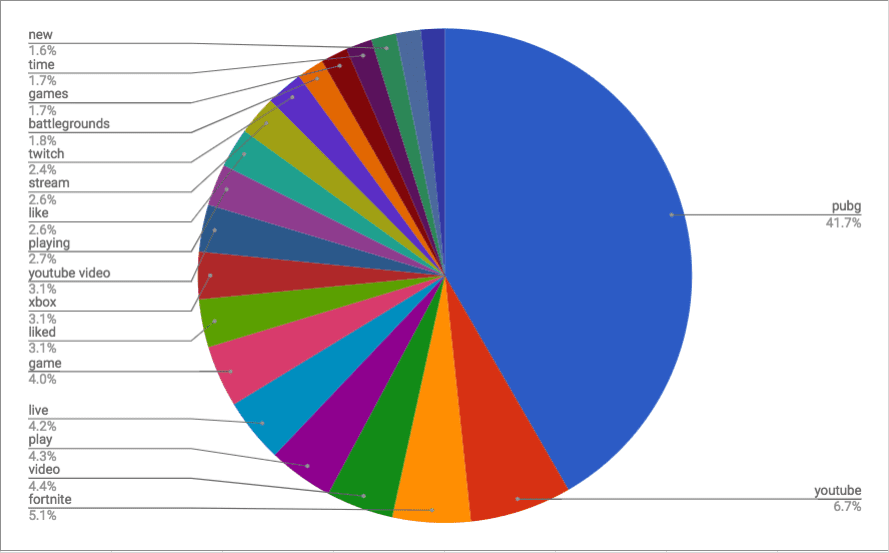
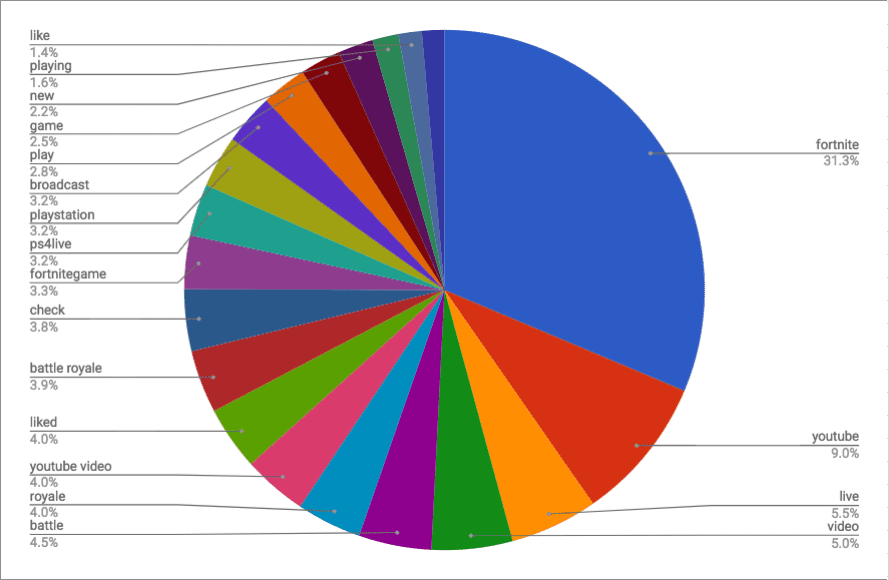
The results show us the conversation around these games online largely relates to streaming. Words like “twitch”, “youtube”, “live”, and “streaming” made for a large part of the set outside the actual name of the game.
PUBG & Fortnite Top 20 Keywords
PUBG Keywords Results
Fortnite Keywords Results
I hope this post helped you learn a little more about getting started with data science, as well as effectively using Google Sheets. If you’d like to learn more or are looking to implement a machine learning solution for your business, reach out to us at contact@indico.io.
Effective January 1, 2020, Indico will be deprecating all public APIs and sunsetting our Pay as You Go Plan.
Why are we deprecating these APIs?
Over the past two years our new product offering Indico IPA has gained a lot of traction. We’ve successfully allowed some of the world’s largest enterprises to automate their unstructured workflows with our award-winning technology. As we continue to build and support Indico IPA we’ve reached the conclusion that in order to provide the quality of service and product we strive for the platform requires our utmost attention. As such, we will be focusing on the Indico IPA product offering.